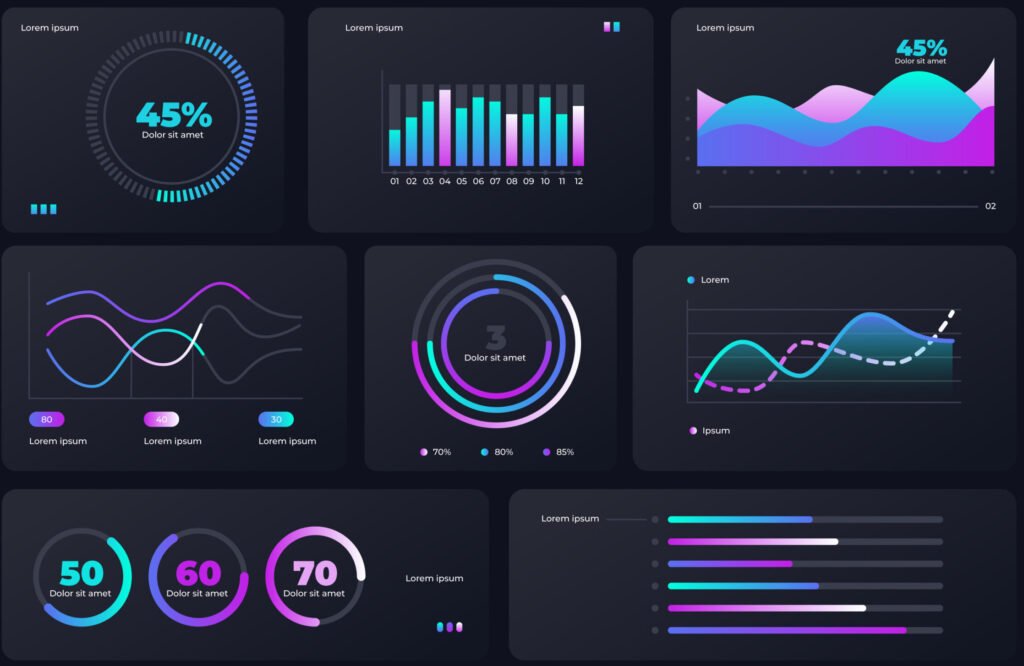
Overall Equipment Effectiveness (OEE) Dashboard
Achieve Operational Excellence with Real-Time Data Insights. Optimize Your Manufacturing Efficiency with Our Expert Power BI Services

Data Visualization
Enable OEE tracking with real-time Power BI data visualization dashboards
OEE Analytics
Real-time data-driven insights and monitoring to optimize operational efficiency
Customized Reporting
Access customized reports showcasing a range of KPIs for OEE tracking

Using OEE in Production
Overall Equipment Effectiveness (OEE) is a performance metric used to evaluate the productivity and efficiency of manufacturing equipment. It evaluates three key factors: availability, performance, and quality, and provides a single value that represents the overall effectiveness of a piece of equipment or an entire production line.
A high OEE score indicates that the equipment runs optimally, with decreased downtime, high output, and minimal defects.
With OEE analytics, you can:
-
Improve Producation Capacity
-
Increase profitability
-
Meet quality standards
Empower your manufacturing with a Power BI OEE dashboard
Power BI OEE dashboard is a powerful tool for manufacturers to analyze and improve the efficiency of their operations.
Offers a comprehensive view of equipment’s efficiency, analyzes downtime, and helps you identify bottlenecks.
Acts as a real-time manufacturing KPI dashboard that offers deep insights into high-performance metrics and enables KPI Tracking.
Power BI OEE dashboard is a powerful tool for manufacturers to analyze and improve the efficiency of their operations.
Why choose Saheshinvestment for OEE Dashboards?
- Proven Expertise
Expert in OEE optimization and implementation - Customized Solutions
Tailored solutions for unique manufacturing processes - Seamless Integration
OEE dashboard integration without disrupting production - Industry-Leading Technology
Most advanced and effective OEE analytics solutions

